I don’t have a great intuition for expected network latency so I did some experiments on comparing network latency between Austin, TX and other locations.
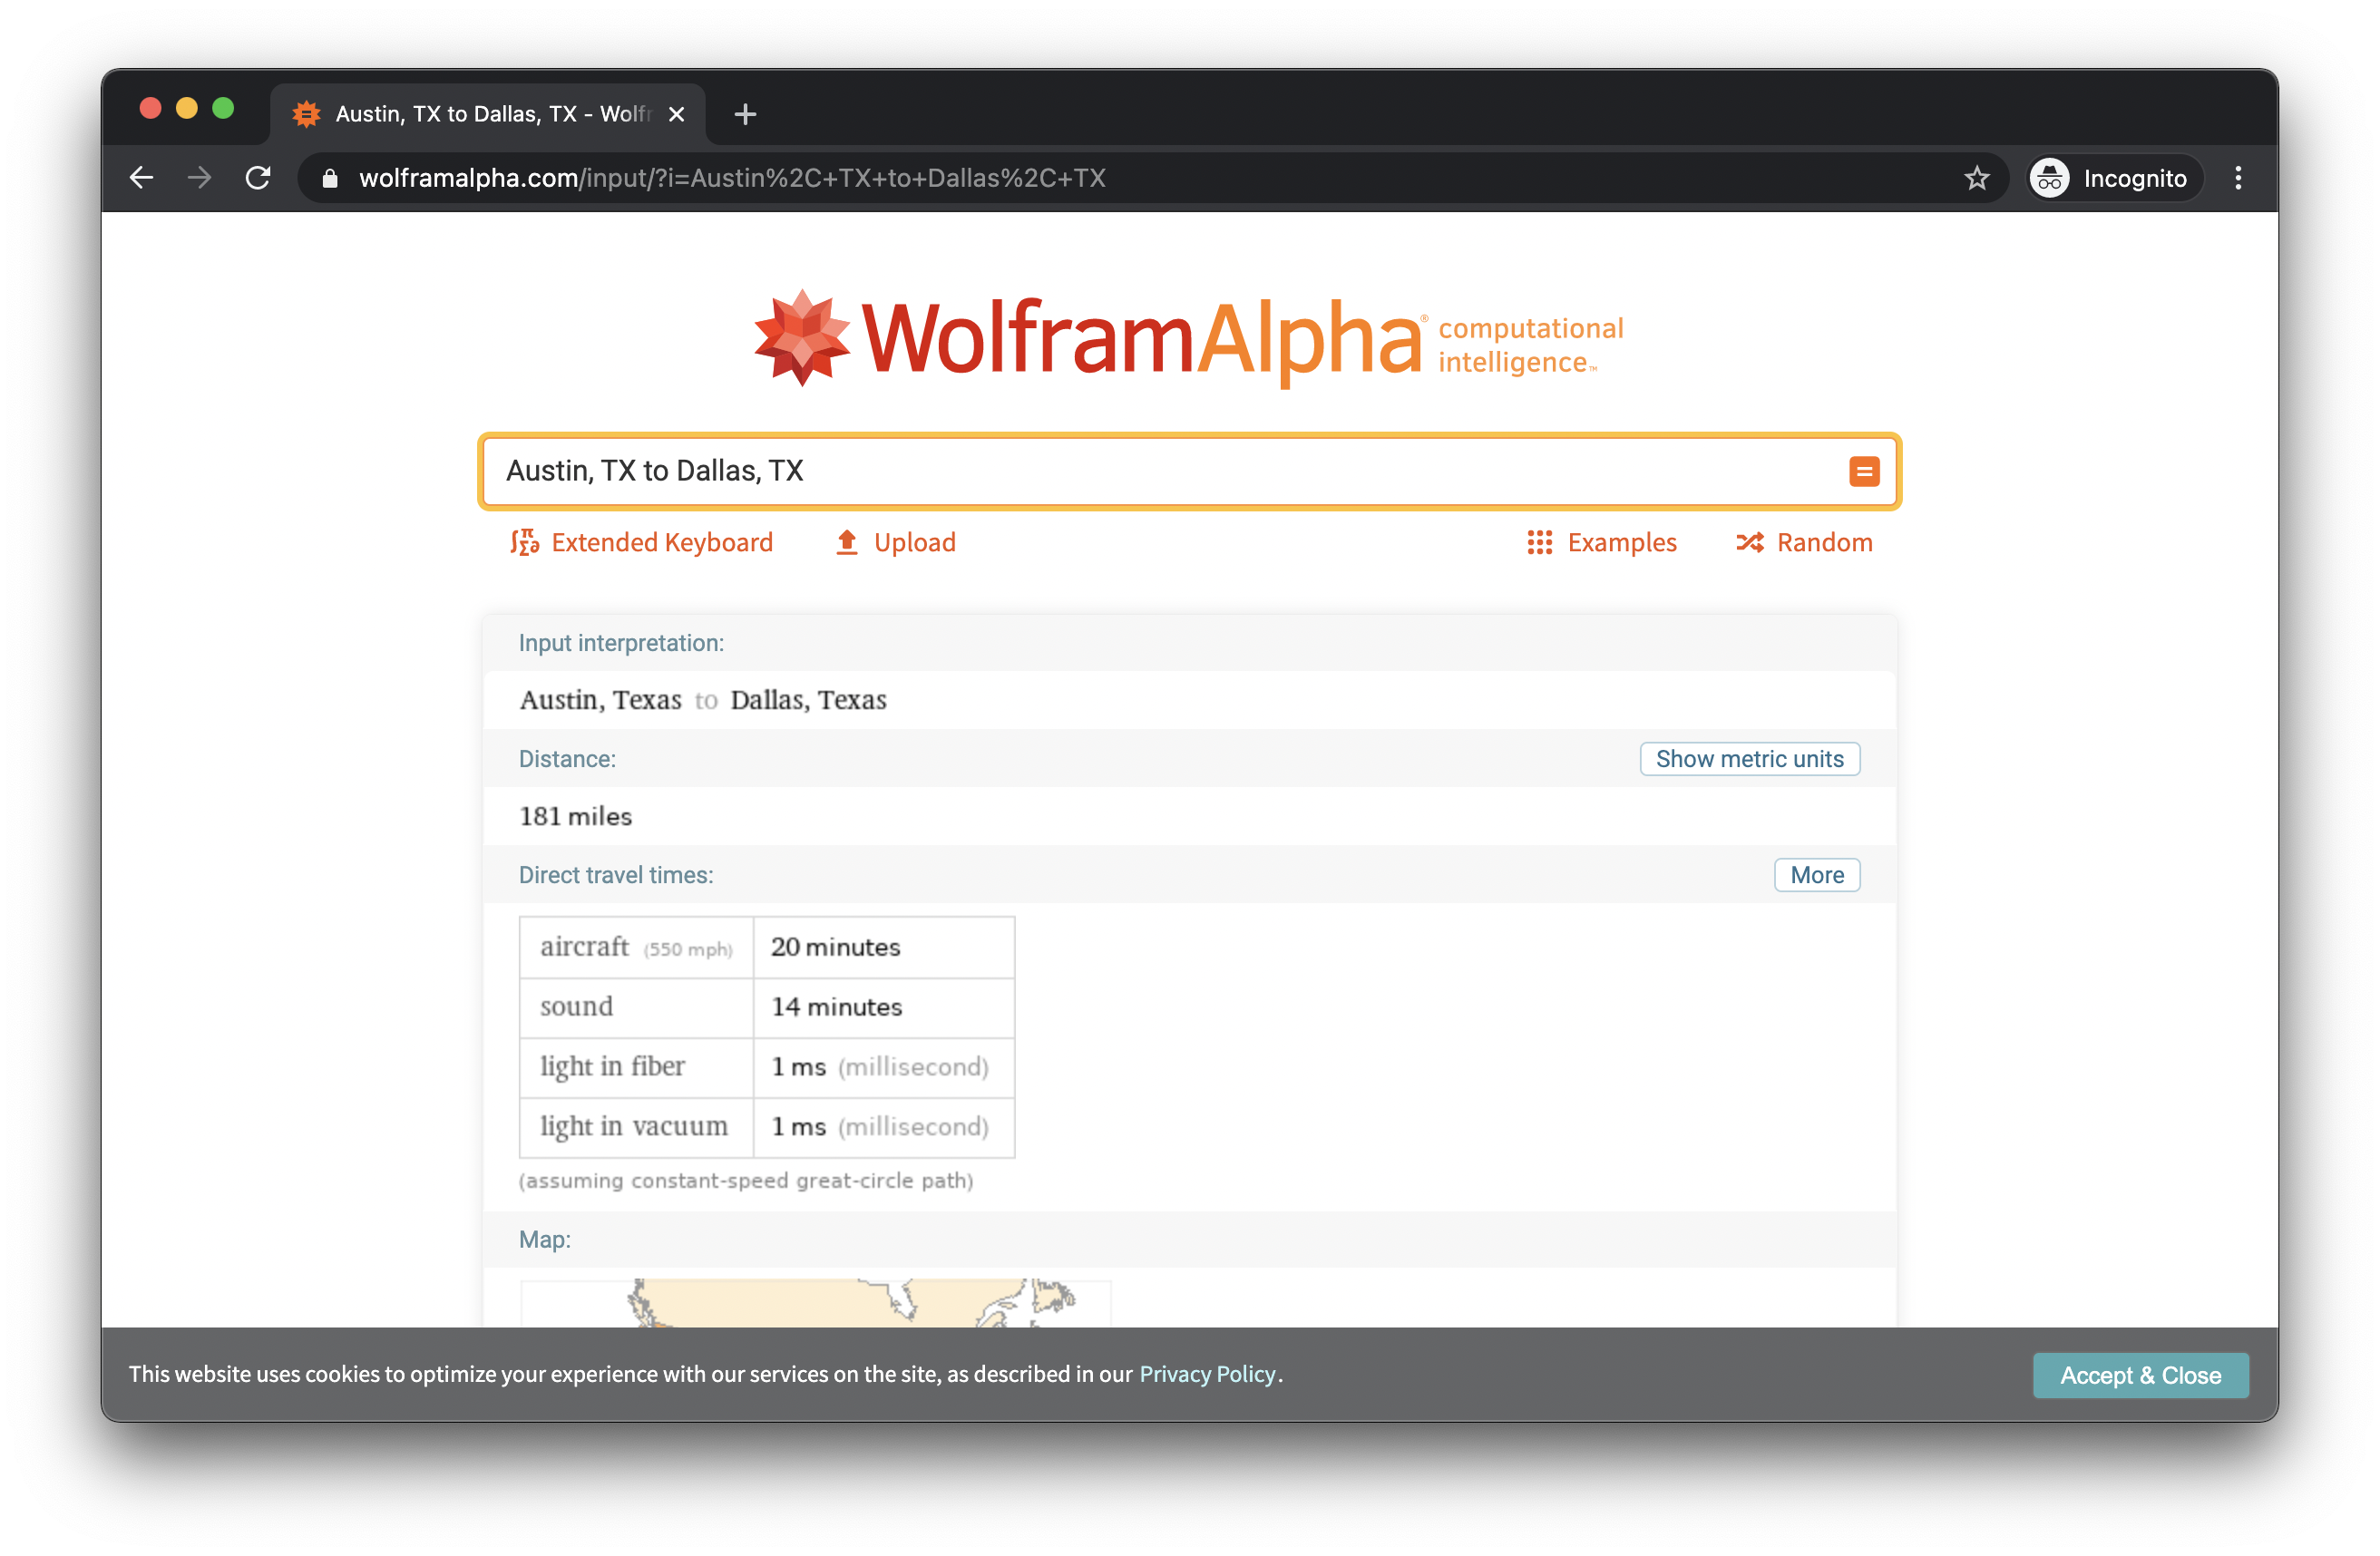
A good starting point seemed like finding a reasonable estimate for the best possible latency. Wolfram Alpha will show straight line travel times using the speed of light in fiber between two locations which gives a useful lower bound for estimating latency. No network traffic traveling from e.g. Austin to Dallas would beat the speed of light traveling through a fiber line so we could assume that a packet from Austin to Dallas would take at least 1ms for each leg of the trip.
Vultr has a list of hostnames that correspond to specific locations
here
so we can also see what the actual RTT
would be. A mtr run on an older Raspberry Pi B+ hooked up to my home router
in Austin shows latency of 9.7ms on average.
$ mtr tx-us-ping.vultr.com -rwc 25
Start: 2021-03-28T19:39:35+0100
HOST: raspberrypi                Loss%   Snt   Last   Avg  Best  Wrst StDev
<snip>
 12.|- 108.61.224.175.vultr.com   0.0%    25    9.9   9.7   8.5  11.1   0.5
I repeated this process a few times for various Vultr servers. All times use
Austin as a source. I used mtr $VULTR_HOST -rwc 25 for each test.
| Destination | Light in fiber (ms) | mtr Average (ms) |
|-------------+---------------------+------------------|
| Dallas      |  1                  |   9.7            |
| Atlanta     |  6                  |  25.4            |
| Chicago     |  7                  |  37.4            |
| Miami       |  8                  |  45.6            |
| Los Angeles |  9                  |  35.8            |
| Santa Clara | 11                  |  42.4            |
| New Jersey  | 11                  |  39.1            |
| Seattle     | 13                  |  56.2            |
| London      | 37                  | 113.0            |
| Amsterdam   | 38                  | 123.3            |
| Frankfurt   | 40                  | 123.1            |
| Sydney      | 64                  | 192.4            |
The light in fiber travel times from Wolfram Alpha are for a single leg of the trip so it seems like a reasonable approximation to expect a 4.8x to 1.5x increase in latency from the best case estimate.
I assume at closer distances last mile problems are more prominent as the 4.8x increase is a bit of an outlier. Ignoring Dallas results, the latency multiple is in the 1.5x-2.5x range.
This isn’t the exact script I used for the data above but you could test this yourself using this bash script I wrote.